

What are the cost - benefit analysis methods for a POP Floor Display?
Dec 22, 2025
Leave a message
What are the cost - benefit analysis methods for a POP Floor Display?
As a provider of POP Floor Displays, I've witnessed firsthand the significant role these displays play in the retail environment. Point of Purchase (POP) floor displays are integral to attracting customers and driving sales. However, like any business investment, it's essential to conduct a thorough cost - benefit analysis before diving in. In this blog post, I'll explore various methods for performing such an analysis to help you make informed decisions.
1. Direct Costing
The first step in any cost - benefit analysis is to understand the direct costs associated with POP floor displays. These can be broken down into several categories:
- Manufacturing Costs: This includes the raw materials, labor, and overhead involved in producing the display. For example, if you're interested in Acrylic Floor Display Stands, the cost of high - grade acrylic sheets, the cutting, shaping, and finishing processes, along with the wages of the workers, are all part of the manufacturing costs. Similarly, for Metal Floor Display Stands, the cost of metals, welding, and painting contribute to this expense.
- Shipping and Logistics: Once the displays are manufactured, getting them to the retail location incurs costs. Freight charges, packaging materials, and insurance during transit are all factors to consider. Shipping large and bulky POP floor displays can be a significant expense, especially if they are being sent to multiple locations.
- Installation and Setup: At the retail site, the displays need to be installed and set up. This may require additional labor costs, especially if the installation is complex. Some displays may need to be assembled on - site, and trained personnel may be required to ensure they are set up correctly and safely.
To calculate the direct cost, simply sum up all these individual costs. For instance, if the manufacturing cost of a display is $500, shipping costs $100, and installation costs $50, the total direct cost is $650.
2. Indirect Costs
In addition to direct costs, there are also indirect costs that need to be factored into the analysis.
- Space Costs: POP floor displays take up valuable retail space. The cost of this space should be allocated based on the area the display occupies. This can be calculated by dividing the total rent of the retail store by the total square footage and then multiplying by the square footage used by the display. For example, if a store pays $10,000 per month in rent and has a total area of 2000 square feet, and the display takes up 50 square feet, the monthly space cost for the display is ($10,000 / 2000) * 50 = $250.
- Maintenance and Upkeep: Over time, the displays may require cleaning, repairs, or updates. These costs can vary depending on the type of display and the environment in which it is placed. For example, a display in a high - traffic area may need to be cleaned more frequently, and a metal display may require rust prevention or painting over time.
3. Revenue Generation Analysis
The primary benefit of a POP floor display is its ability to generate revenue. There are several ways to assess this:
-
Sales Lift: Compare the sales of the products featured on the display before and after its installation. For example, if a product was selling 100 units per week before the display was introduced and 150 units per week after, the sales lift is 50 units per week. Multiply the sales lift by the profit margin per unit to calculate the additional profit generated. If the profit margin per unit is $5, the additional weekly profit is 50 * $5 = $250.
-
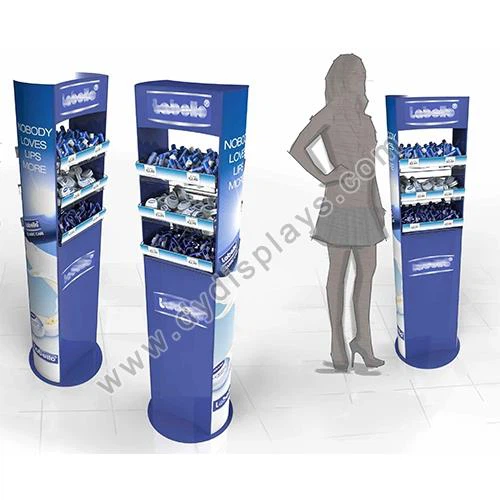
Customer Engagement: Measure how many customers interact with the display. This can be done through in - store traffic counters, surveys, or by analyzing social media mentions related to the display. Higher customer engagement often leads to increased brand awareness and, ultimately, more sales. For example, if a store has 1000 customers per day and 200 of them stop to look at the display, the engagement rate is 20%. A higher engagement rate indicates that the display is attracting attention and has the potential to drive sales.

-
Brand Awareness and Image: A well - designed POP floor display can enhance brand awareness and improve the brand's image. While it's more challenging to quantify these benefits directly in terms of revenue, they can have a long - term positive impact on sales. For example, a modern and eye - catching display can make a brand appear more innovative and appealing to customers.
4. Return on Investment (ROI) Calculation
The return on investment is a crucial metric in cost - benefit analysis. It shows the profitability of the investment in the POP floor display. The formula for ROI is:
[ROI=\frac{Net\ Profit}{Total\ Investment}\times100%]
The net profit is the total revenue generated from the display minus the total costs (both direct and indirect). The total investment includes all the costs associated with the display.
For example, if the total cost of a display over a one - year period is $10,000 and the additional profit generated from the display during the same period is $15,000, the ROI is (\frac{15000 - 10000}{10000}\times100% = 50%). A high ROI indicates that the investment in the display is profitable.
5. Break - Even Analysis
A break - even analysis helps determine the point at which the revenue generated from the display equals the total costs. This is important because it shows how long it will take for the display to start making a profit.
The break - even point (in units) can be calculated using the formula:
[Break - Even\ Point=\frac{Total\ Fixed\ Costs}{Contribution\ Margin\ per\ Unit}]
The total fixed costs are the sum of all the costs that do not change with the number of units sold, such as the manufacturing cost, shipping, and installation. The contribution margin per unit is the selling price per unit minus the variable cost per unit.
For example, if the total fixed cost of a display is $5000, the selling price per unit of the product on the display is $20, and the variable cost per unit is $10, the break - even point is (\frac{5000}{20 - 10}=500) units. Once the store sells 500 units of the product, the display has covered all its costs, and any additional sales will result in profit.
6. Long - Term vs. Short - Term Analysis
When performing a cost - benefit analysis, it's important to consider both the long - term and short - term impacts.
- Short - Term: In the short term, the focus is often on immediate sales lift and quick recouping of costs. For example, a seasonal display may be designed to drive sales during a specific holiday period. The cost - benefit analysis for a short - term display should consider the sales potential during that limited time frame.
- Long - Term: Long - term displays can have a more significant impact on brand awareness and customer loyalty. The cost - benefit analysis for a long - term display should take into account the cumulative effects on sales over time, as well as the potential for repeat business.
In conclusion, a comprehensive cost - benefit analysis of POP floor displays is essential for making informed business decisions. By carefully considering all the costs, both direct and indirect, and accurately assessing the revenue - generating potential, businesses can determine whether an investment in a POP floor display is worthwhile. If you're interested in exploring our range of Floor Display Stands or have questions about the cost - benefit analysis for your specific needs, I encourage you to reach out to discuss procurement and negotiation opportunities.
References
- Kotler, P., & Armstrong, G. (2018). Principles of Marketing. Pearson.
- Levitt, T. (1960). Marketing Myopia. Harvard Business Review.